⚡ Lighthouse Weekly
2026-07-10
A quick note
Welcome — especially to those of you getting this for the first time. This is the first Lighthouse newsletter in five weeks; client work took over and I let this slide. Thanks for still being here.
What I'm trying to do here is simple: give you the actual data on what's moving markets, with honest framing and no hype. Every week I read every reply, and I'll be a better version of this the more of you tell me what's landing. Let's get into it.
— Graham
What I'm trying to do here is simple: give you the actual data on what's moving markets, with honest framing and no hype. Every week I read every reply, and I'll be a better version of this the more of you tell me what's landing. Let's get into it.
— Graham
This week's takeaway
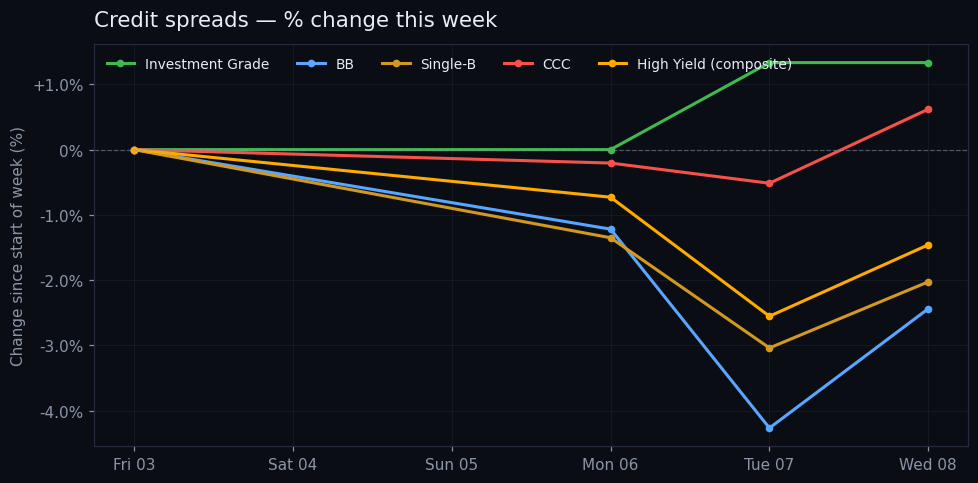
Five weeks of macro compressed into one edition. The Fed pivoted hawkish under new Chair Warsh (June 17): unanimous 12-0 hold at 3.50-3.75%, but the dot plot flipped from a cut to a hike, and 17 of 18 officials now see inflation risks tilted upside. The Bank of Japan hiked to 1% (June 9), highest since 1995. Yet credit largely shrugged: HY composite sits at the 7th percentile (historically calm), BB at the 2nd. The one exception is CCC, which continues to grind wider — 9.75% now, up 26bps over the month, 86th percentile. The composite stress score dropped from 41.6 to 34.4 across the gap, reinforcing the 'compressed, complacent — until the weakest tier isn't' read. The long end of the curve did back up sharply this week, with the 30Y up 15bps and 10Y up 12bps.
📊 The state of play
The dispersion story has sharpened, not entrenched. In Edition 3 the framing was 'every tier widening together, direction changed.' That's reversed. BB has compressed to the 2nd percentile — effectively as tight as it has been in three years. Single-B tightened from the 30th to the 18th percentile. Even HY composite is back to the 7th. The only outlier is CCC, still pushing wider (86th percentile, +26bps on the month). Historically that gap closes one of two ways: CCC eases off — usually needing a Fed pivot or improving credit conditions — or higher-quality tiers eventually follow the weakest lower. Neither has happened yet. Meanwhile the long end of the Treasury curve backed up notably this week, with the 30Y up 15bps and the 10Y up 12bps, consistent with the sticky-inflation read the Fed leaned into on June 17.
📉 Credit stack
📰 The week in macro
- The defining event of the past five weeks was Kevin Warsh's first FOMC as Chair on June 17. The committee held rates at 3.50-3.75% unanimously (12-0, a marked change from the 8-4 split in April), but the projections turned hawkish: the median 2026 rate rose from 3.4% to 3.8%, implying at least one hike this year (CNBC, Fed SEP). Warsh dropped forward-guidance language pointing to future cuts and formed task forces to review Fed communications. Fed-funds futures repriced from a ~24% probability of a 2026 hike a month earlier to ~77% after the meeting. The 2Y jumped 14-16bps on the day. Alongside the Fed pivot, the Bank of Japan raised its policy rate to 1% on June 9 — the highest since 1995 — citing upside inflation risks (Nikkei). Together these mark a coordinated global tightening bias that credit markets have so far absorbed calmly.
- Treasury cash balances drew down sharply, with the TGA falling $106bn on the week to $774bn, while bank reserves rose $132bn to $3.10T — a net liquidity injection into the banking system that helps explain why IG and BB spreads have not budged despite the yield backup.
- Reverse repo balances remain negligible at $5.77bn, confirming the money-market cash sponge is effectively empty — a structural backdrop worth keeping in mind as Treasury issuance dynamics evolve.
📈 Rates
👀 Watching next week
Whether CCC is the leading indicator or an isolated pocket
CCC sits at the 86th percentile while every other tier compressed further. Two paths from here. Either CCC eases off — which historically needs a Fed pivot or a genuine improvement in default expectations — or higher-quality tiers eventually catch down to the weakest. The trigger to watch is BB or Single-B failing to hold their multi-year tights on the next credit-negative headline. If that happens, the dispersion story stops being 'CCC alone' and becomes something bigger.
Ready to ship?
✓ Looks good — send
Changes shown as: 1d = previous trading day · 5d = past trading week · 30d = past month.
Drafted by AI from Lighthouse data + scored news. Reviewed and edited by Graham before send.
Live dashboard: macrolighthouse.com
Drafted by AI from Lighthouse data + scored news. Reviewed and edited by Graham before send.
Live dashboard: macrolighthouse.com